
One of the most persuasive ways to build brand awareness online is to incorporate real estate agent infographics into your content marketing strategy.
Not all content is created equal. There’s a reason that 55% of B2C content producing companies rated visual content as their top priority.
Pearson reports that 65% of the population are visual learners. Hubspot notes that an infographic is 30 times more likely to be read than pure text. And Massplanner explains that infographics are shared 3 times more than any other type of content.
But, how do you create your own infographics that are useful to your audience, convert the right people into leads, and don’t look hideious?
Well, that’s why you’re here.
Because you’re not a designer or a professional content marketer, you’re a real estate agent. But, as we’re going to see, that doesn’t mean you can’t put together some lead-generating real estate infographics.
Here’s a three-step process for creating your very own real estate agent infographics: Choose an idea. Find your formatting. Use these tools.
Real Estate Agent Infographics – Pick an Idea
As with any piece of content, you need an idea. And brainstorming is the best way to dig up ideas. But since you probably don’t have a real estate infographic guru sitting next to you, and brainstorming on your own is boring, we’ve done the digging for you. Here are 5 examples of infographics that you, as a real estate agent, can steal ideas from.
(1) 3 Ways Real Estate Agents are Better than “For Sale By Owner.”

The perks of explaining — in an infographic — why someone should use a real estate agent are obvious… especially if you are one. If prospects believe they need an agent to sell their house, and you’re the one who convinced them of that, they’ll likely be giving you a call.
(2) 5 Industry Facts & Figures for 2017

Creating an infographic that illustrates the market’s health is a benefit to homebuyers and sellers alike. Anyone looking to purchase or peddle a house is likely interested in the market’s current wellbeing. This will help inform prospects of a ripe market and — if you include your phone number on the bottom — of who to call for help.
(3) To-Do List for First-Time Homebuyers

This infographic is wildly helpful for the person looking to buy their first home. Every first-time buyer has worries, concerns, and doubts about the buying process. Creating a piece of content that covers the steps of purchasing a house helps to dilute these uneasy feelings — making the procedure seem a whole lot easier.
(4) 10 First-Time Homebuyer Mistakes

Nobody wants to walk into a pole — whether that’s physical or metaphorical. Homebuyers are filled with fears of what could go wrong in choosing a house, purchasing the house, picking a real estate agent, getting a loan, and moving in. The infographic above does a nice job of ensuring that these fears don’t paralyze a prospect.
(5) Home Improvements that Pay Off

Ever wondered what pays off on house remodels? Sure you have. And so has your potential client. Make an infographic that has information on what sort of remodels are the best to pursue. Again, the idea is to aid the person looking for help. If you help them now, you’ll likely get to help them again when they need an agent.
Choose a Format
Infographics are able to illustrate concepts that words cannot. Because of that, it’s important to consider what kind visual formatting you should use. Above all, don’t get fancy.
The simpler your real estate infographic, the easier it is to understand and the more people who will engage with it. Here are some formats to consider from beautiful — but simple — real estate agent infographics.
The formats are organized from easiest to hardest in regards to their creditability. Don’t be afraid to start at the beginning.
(1) The Numbered List

The numbered list format is common for a reason. It’s easy to read, effective at illustrating simple pieces of information, and guides the eye seamlessly from point to point. Simply choose a number of tips, don’t-do’s, or guidelines and fill in the blanks. Start here if you’ve never created an infographic before.
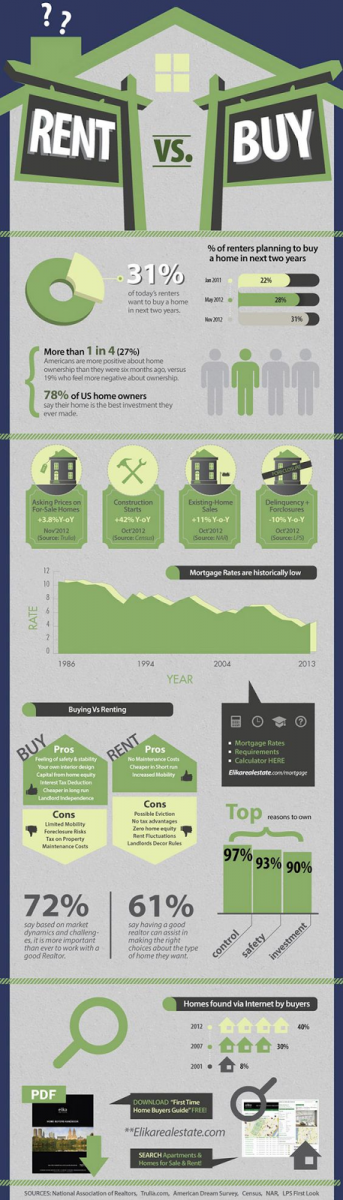
(2) The Stat Card

This infographic is nearly as simple as the numbered list format but requires a bit more research. Use the stat card format when wanting to provide useful information for the prospective client, such as when to sell, best house investments, or any other topic that’s data-driven.
(3) The Comparison
Buying or selling a home is riddled with choices. How many beds and baths should I have? Am I getting my money’s worth? Should I rent instead of buying? Which is exactly why this format is fantastic for helping the prospect to make a decision.
Ask yourself what kind of questions clients have for you and then create a comparison infographic to provide the pros and cons of each option.
(4) The Flow Chart

Building this kind of infographic requires some creativity beyond the previous templates. But the basic idea is allowing the infographic to guide someone from point A to point B.
Visually on the graphic, and contextually on the info, the piece gives the viewer an idea of what it will take to make the journey — whether it be from renting to buying, from owning to selling, or from selling to investing.
(5) The Form Fits Function
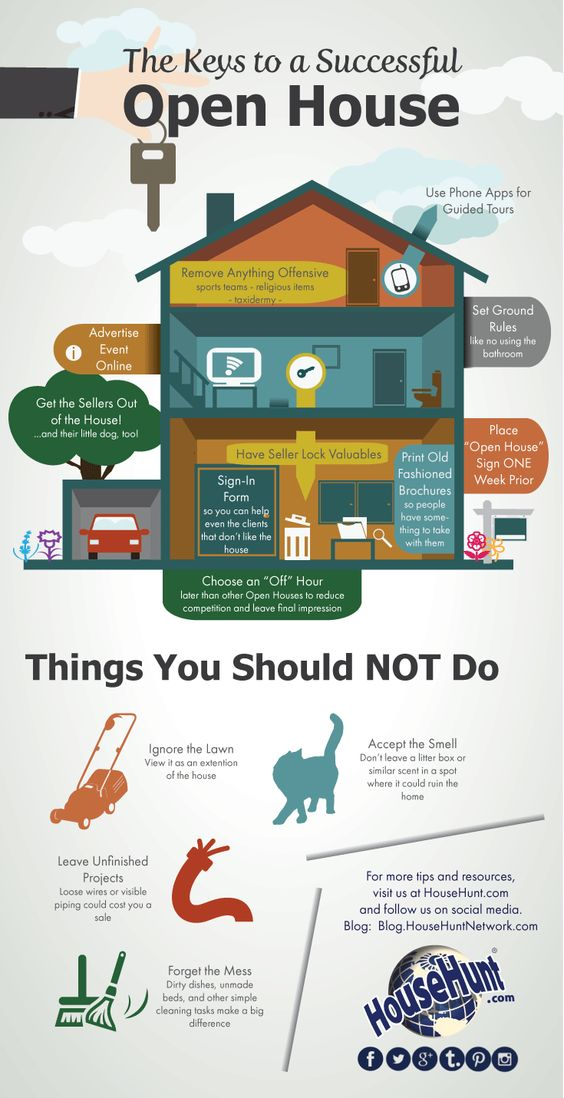
This format for an infographic is one of the most creatively demanding. As you can see in the image above, the tips are placed visually within a house. Thus, the form matches the function. While this kind of infographic is beautiful to look at, it’s unnecessary. Unless you have the creative power, time, or money to design this kind of brilliant, free-flowing infographic, don’t.
Use these Tools
Thinking up an infographic in your head is one thing. Creating it is quite another. But, lucky for you, in our age of digital stampedes and marketing masters, anyone — including a real estate agent — can become a graphic design artist. Here are two tools you can use to create your own infographic right now for free.
(1) Venngage
Just in case you think you’re too good for an infographic creator, be aware that huge companies including Google, Hubspot, Microsoft, and Forbes all use Venngage. In today’s world, a great tool is utilized by the small and the big alike. Venngage is such a tool. Join up for free and it will walk you through designing your very first infographic.

(2) Canva
More versatile than Venngage — and still free to use — is Canva, a holistic graphic design platform. You can edit images, design a logo, and create banners, flyers, and infographics. Great for the inexperienced graphic designer.

A Final Tip
Yes. Your audience is three times more likely to share an infographic than they are to share any other piece of content. But, that’s only the case if you make your infographic easy to share. Whenever you post an infographic, always include the embed code so that people can easily share it to either social media or on their own blog. On our infographic explaining SEO and PPC, we included shareable buttons and the embed code, to maximize the size of its wings.

Keep it Visual, Fun, and Data-Driven
Visual content will continue to be powerful because human nature demands it. And real estate agent infographics, in particular, are powerful because they are a visual representation of helpful, inspiring, and insightful data. Plus, now that tools to create your own infographics abound, you’re out of excuses.
Remember, no first draft of content ever comes out perfect. So above all, just start. And keep in mind what you’ve learned here.
The program looks great!
I will give it strong consideration during my research!